Palm Beach County's jobless rate was 4.6% in August, up from 4.3% a year earlier, with about 2,400 more people out of work. Florida was also 4.6%.
Updated Oct. 31: September’s figures are out. The county’s rate was 4.4%, and the BLS revised the August counts: 35,839 unemployed and 737,270 employed in a labor force of 773,109, with the rate unchanged at 4.6%. Read the September story.
Palm Beach County’s unemployment rate was 4.6% in August, up from 4.3% in August 2025. About 35,862 county residents were out of work and looking for a job. That is 2,367 more than a year earlier.
The figures are the preliminary August estimates from the U.S. Bureau of Labor Statistics’ Local Area Unemployment Statistics program. The county rate takes in Palm Beach Gardens and its neighbors. The figures are not seasonally adjusted, so the fair comparison is with the same month a year earlier.
Palm Beach County against its neighbors
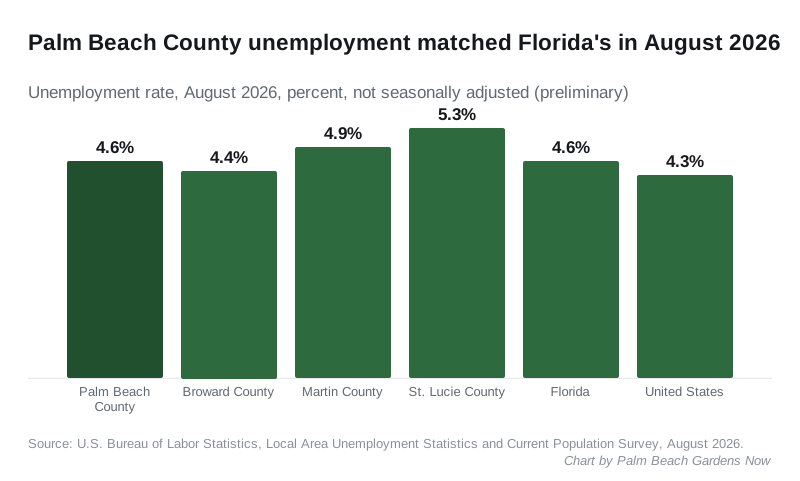
| Area | August 2026 | August 2025 |
|---|---|---|
| Palm Beach County | 4.6% | 4.3% |
| Broward County | 4.4% | 4% |
| Martin County | 4.9% | 4.6% |
| St. Lucie County | 5.3% | 5% |
| Florida | 4.6% | 4.3% |
| United States | 4.3% | 4.5% |
All rates are not seasonally adjusted. Sources: BLS series for Broward County, Martin County, St. Lucie County, Florida and the United States.
Palm Beach County’s rate rose 0.3 points from a year earlier. So did the rates in Martin and St. Lucie counties to the north and the statewide rate. Broward County, to the south, rose 0.4 points. The national rate moved the other way, from 4.5% to 4.3%.
The numbers behind the rate
Across Palm Beach County in August, according to the BLS:
- 773,792 people were in the labor force, against 773,226 a year earlier.
- 737,930 people had jobs, down from 739,731.
- 35,862 people were unemployed, up from 33,495.
The labor force counts people who have a job or are looking for one. The rate is the share of that labor force without a job and looking. These are counts of county residents, wherever they work, not counts of jobs based in the county.
The labor force was almost the same size as a year ago. About 1,800 fewer residents were working, and about 2,400 more were looking for work.
The past year, month by month
The county’s rate moved between 4.3% and 4.9% over the year. It was lowest in August and September 2025 and highest in November 2025 and January 2026.
| Month | Palm Beach County | Florida |
|---|---|---|
| August 2025 | 4.3% | 4.3% |
| September 2025 | 4.3% | 4.2% |
| October 2025 | not published | not published |
| November 2025 | 4.9% | 4.8% |
| December 2025 | 4.5% | 4.4% |
| January 2026 | 4.9% | 4.9% |
| February 2026 | 4.8% | 4.8% |
| March 2026 | 4.4% | 4.4% |
| April 2026 | 4.5% | 4.6% |
| May 2026 | 4.4% | 4.4% |
| June 2026 | 4.6% | 4.6% |
| July 2026 | 4.7% | 4.6% |
| August 2026 | 4.6% (preliminary) | 4.6% (preliminary) |
Because the figures are not seasonally adjusted, a change from one month to the next can reflect the season, not a change in the job market. There is no October 2025 figure. The BLS lists that month as unavailable because of the lapse in federal appropriations that fall.
What it means for you
- If you are looking for work, the state’s Employ Florida job board lists openings across Palm Beach County.
- The August numbers will change. The BLS marks the latest month as preliminary and revises it the following month.
- September’s figures for the county come in the next BLS release for local areas. The national September rate is already out, at 4%. We will update this story when the county figure is published.
- For more on the local economy, see our pages on new businesses and home prices.
Have your say